


UX & SEO: The Hidden Signals Google Uses to Judge User Experience
Beyond Core Web Vitals: The Behavioral Signals Most SEO Teams Ignore.
For years, SEO and UX lived in entirely separate worlds. SEOs chased backlinks and keyword density. Designers obsessed over aesthetics. The two disciplines rarely shared a roadmap, let alone a strategy.
Today, understanding how UX impacts SEO is critical for any business trying to improve rankings and conversions simultaneously. Google no longer evaluates pages based only on keywords and backlinks. It evaluates how users interact with your website, how long they stay, how quickly they engage, and whether the experience satisfies search intent.
The problem is that most coverage of this topic stops at the surface: “make your site faster, make it mobile-friendly.” Those things matter, but they are only the beginning. Beneath Core Web Vitals sits a second tier of signals pogo-sticking patterns, dwell time thresholds, GoodClicks and BadClicks, Chrome bookmark rates that almost nobody is optimizing for because almost nobody knows they exist.
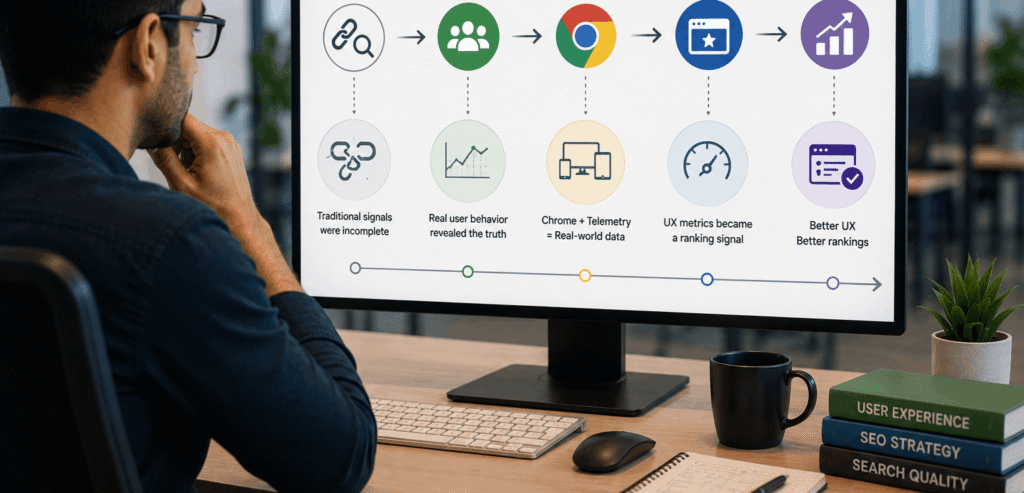
Why Google Started Measuring User Experience
The turning point came in 2021 with Google’s Page Experience Update but the groundwork had been laid quietly for years before that. Google’s search quality teams knew that traditional signals like backlinks and keyword matching were necessary but incomplete proxies for whether a page was genuinely useful.
The answer was behavioral data. Google’s Chrome browser, with its massive installed base and opt-in telemetry, gave the company something no competitor had: real-world data on how actual users interacted with billions of pages across billions of devices. Not simulated lab scores. Not survey responses. Aggregate behavioral reality.
The Page Experience Update formalised this, bundling user experience metrics into an explicit ranking signal. The message was unambiguous: a page that frustrates users slow, unstable, cluttered with interstitials will be penalised regardless of how strong its content or link profile is.
This shift permanently changed the relationship between UX in SEO. User experience is no longer a secondary design concern. It directly influences how search engines evaluate quality and relevance.
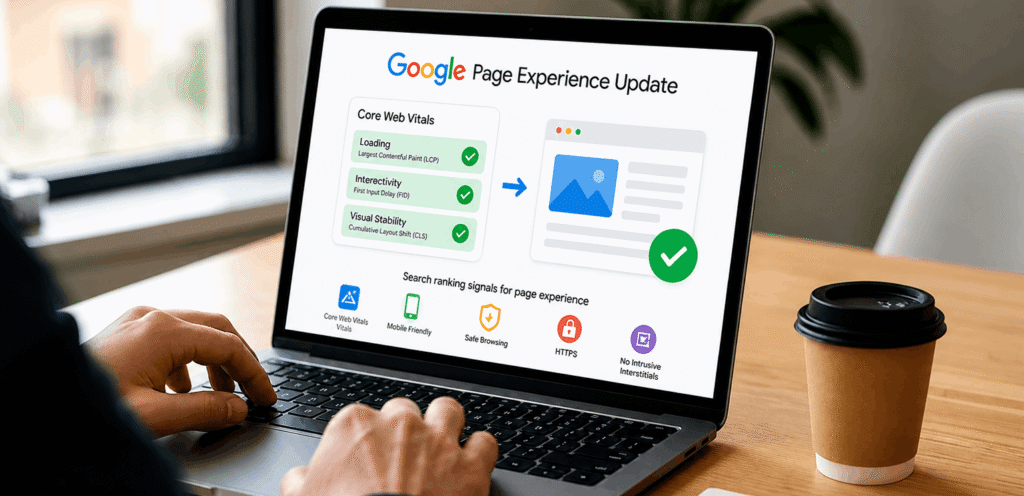
The Official Tier: Core Web Vitals
Core Web Vitals are the only UX signals Google has explicitly confirmed as direct ranking factors. They pull from CrUX field data, not PageSpeed Insights lab scores which means they reflect how users on real devices and real connections actually experience your pages.
There are three metrics. Each has a precise target threshold, a clear consequence for failing it, and a specific set of fixes.
✓
Largest Contentful Paint (LCP) — Perceived Load Speed
LCP measures the time from navigation start to when the largest visible element on screen typically a hero image or the main text block fully renders. It is Google’s proxy for ‘how fast does this page feel to load?
Target: under 2.5 seconds. Pages above 4 seconds are rated ‘Poor’ and receive a ranking penalty.
The most common culprits for slow LCP: unoptimised hero images, render-blocking JavaScript, and slow server response times. Fixing the largest element on your above-the-fold content is usually the single highest-ROI technical change you can make.
✓
Interaction to Next Paint (INP) — Responsiveness
INP replaced First Input Delay (FID) in March 2024. The key difference: FID only measured the latency of the very first user interaction on a page. INP measures the latency of every interaction clicks, taps, and keyboard events throughout the entire session. It is a far more demanding and representative metric.
Target: under 200 milliseconds. The primary cause of poor INP is JavaScript specifically, heavy main-thread work that blocks the browser from responding to user input.
Audit your third-party tag load (analytics, chat widgets, ad scripts). These are frequently the source of interaction delays that inflate INP scores.
✓
Cumulative Layout Shift (CLS) — Visual Stability
CLS measures how much page content unexpectedly shifts during load. If elements jump around as images load or ads inject above existing content, your CLS score climbs and with it, user frustration.
Target: score below 0.1. The fastest fix: add explicit width and height attributes to all images and embeds. Missing dimensions are responsible for the majority of CLS failures.
Metric
LCP
INP
CLS
Target
< 2.5s
< 200ms
< 0.1
Primary Fix
Compress hero images, reduce server response time, defer non-critical JS
Audit JS execution time, remove heavy third-party scripts
Declare image/embed dimensions, avoid injecting content above the fold
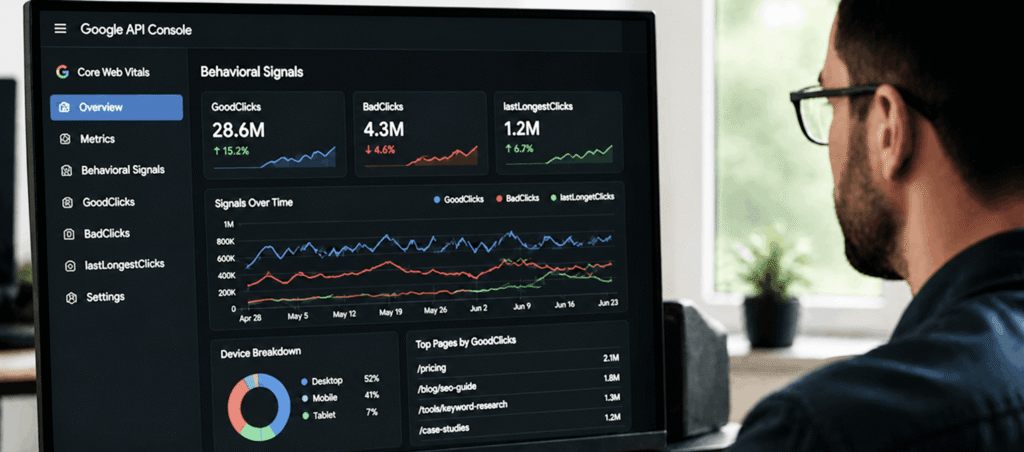
The Hidden Tier: Behavioral Signals Google Watches
Core Web Vitals are the public-facing part of Google’s UX evaluation. But behavioral signals the patterns in how users interact with your pages and with the SERP itself form a second, less-documented tier that carries significant weight.
These signals come primarily from Chrome telemetry and from Google’s own SERP interaction data. Many were confirmed through leaked internal Google API documentation in 2024, which revealed metrics like lastLongestClicks, GoodClicks, and BadClicks as active ranking inputs.
Understanding these patterns is essential when analyzing how UX impacts SEO beyond technical performance metrics alone.
✓
Dwell Time: The 'Long Click' Signal
Dwell time how long a user spends on your page before returning to the SERP is Google’s clearest behavioral proxy for content quality. A user who lands on your page and stays for four minutes almost certainly found what they were looking for. A user who leaves in eight seconds did not.
According to Backlinko’s 2024 ranking factors analysis, top-ranking pages have an average dwell time of approximately 3 minutes. Pages in the top 10 positions show significantly lower bounce rates than those on page two.
Google internally tracked this metric under the label lastLongestClicks in leaked API documentation confirming that dwell time is not speculative but a measured, named signal in Google’s systems. The practical implication: content that answers the query immediately and then rewards continued reading is the target format.
✓
Pogo-Sticking: The Most Damaging Signal
Pogo-sticking occurs when a user clicks your result, spends only seconds on the page, returns to the SERP, and immediately clicks a competing result. It is one of the most powerful negative signals in organic search.
The fix is front-loading value. Your opening paragraph should directly address the core question of the page’s target query not warm up slowly, not recap the topic, not explain what the article will cover. Answer first. Elaborate second.
This is one of the most effective SEO UX best practices because users decide within seconds whether your content deserves their attention.
✓
GoodClicks vs BadClicks
The 2024 Google API leak revealed that Google differentiates between GoodClicks interactions where users had a positive, satisfying experience and BadClicks, where users showed dissatisfaction signals. Pages that accumulate GoodClicks are rewarded, pages with high BadClick rates are demoted.
These are not metrics you can directly access, but they are downstream outputs of the same user experience factors you can control: relevance of content to query, load speed, page stability, and absence of intrusive elements.
✓
Click-Through Rate (CTR)
Google monitors whether pages receive higher or lower click-through rates than expected for their ranking position. A page sitting at position 4 that earns position-1-level CTR sends a strong relevance signal. The inverse a page at position 2 with abnormally low CTR suggests a mismatch between the title/description and user intent.
CTR is directly controllable through the title tag and meta description copy. Specificity outperforms generality. Numbers, specific outcomes, and clear value propositions consistently outperform generic descriptors. Test your title variants against the impressions and clicks data in Google Search Console.
✓
Scroll Depth
How far users scroll down a page is a measurable proxy for engagement and content consumption. A page where most users read past the halfway point is signalling genuine interest. A page where 90% of users leave after the first screen suggests the content either fails to deliver on its title’s promise or front-loads the answer so completely that there is no reason to continue reading.
For long-form content, structure subheadings to generate genuine curiosity each one should make a reader want to know what comes next. This is not a manipulation; it is good editorial craft that happens to produce better engagement signals.
✓
Chrome Bookmark Rate & Repeat Visits
Google’s Chrome telemetry can measure how often users bookmark pages and how quickly they return for subsequent visits. A high bookmark rate is a durable quality signal — it indicates the content is reference-worthy enough to save. Short intervals between repeat visits indicate habitual, high-value use.
These signals cannot be engineered directly, but they are earned by a specific type of content: comprehensive, frequently-updated reference resources toolkits, data roundups, decision frameworks that users return to rather than search for again.
👉 These signals aren’t easy to optimize but that’s where we come in.
We analyze user behavior, improve engagement metrics, and align your content with Google’s ranking signals.

The Page Experience Checklist: What Else Google Evaluates
Beyond Core Web Vitals and behavioral signals, Google’s Page Experience framework includes a set of additional criteria. Google has stated these do not directly boost rankings on their own, but they correlate strongly with the behavioral metrics that do and they determine whether users trust and stay on your page in the first place.
✓
HTTPS
Confirmed as a ranking signal since 2014. More practically, a browser security warning on an HTTP page guarantees high bounce rates users will leave regardless of content quality. Verify your TLS certificate covers all subdomains and that there are no mixed-content warnings in your browser console.
✓
Mobile-First Indexing
Google indexes the mobile version of your site as the primary version for ranking purposes. If your mobile experience is degraded relative to desktop small tap targets, content wider than the viewport, font sizes below 16px your ranking ceiling is lower than it should be.
✓
No Intrusive Interstitials
Full-screen pop-ups on mobile that appear within the first three seconds of page load are a confirmed negative signal in Google’s Page Experience framework. Legally required notices (cookie consent, age verification) are exempt. Exit-intent overlays and scroll-triggered CTAs carry no known penalty when used proportionately.
✓
Safe Browsing
Pages flagged for malware, phishing, or deceptive content by Google’s Safe Browsing service are heavily demoted. Check the Security Issues report in Google Search Console regularly. Run a malware scan on a quarterly schedule as minimum hygiene.

How Content Structure Affects UX Signals
Improving behavioral signals is not purely a technical exercise. The way you write and structure content directly determines whether users stay, engage, and return or pogo-stick back to the SERP.
✓
Match Depth to Intent
An informational query like ‘how does UX affect SEO rankings’ signals that the user wants a comprehensive explanation. A shallow 500-word article will generate poor dwell time regardless of how fast it loads. Match the depth of your content to the complexity of the intent behind the query.
✓
Answer First, Elaborate Second
The most common structure mistake in blog content is the slow warm-up: three paragraphs of scene-setting before getting to the point. Users conducting a navigational or informational search are evaluating your page within the first 10 seconds. If they don’t find a direct signal that the page addresses their query, they leave.
Lead with the answer. Let the explanation follow.
✓
Internal Linking and Session Depth
Every page a user navigates to after their initial landing adds to session depth and time-on-site metrics. Strategically placed internal links — to genuinely related, deeper content — extend sessions and build topical authority signals simultaneously. The link must be relevant; forced links to unrelated pages will increase exits, not reduce them.
✓
Visual Hierarchy and Readability
A page that is visually coherent, with clear heading hierarchy, adequate line spacing, and reasonable paragraph length, produces better scroll depth than an identical page presented as a wall of text. This is not aesthetics for its own sake — it is a direct driver of the engagement metrics Google uses as quality signals.
Conclusion
Google’s algorithm and your users’ preferences are converging on the same destination. Fast, stable, relevant, trustworthy pages that genuinely answer questions these are the pages that win in organic search, and they are also the pages that satisfy real people.
The hidden signals described in this guide pogo-sticking data, GoodClick accumulation, scroll depth, dwell time cannot be gamed directly. They are the aggregate output of millions of individual user decisions. You earn them by building pages that deserve them. That is why businesses are increasingly partnering with experts like AI-IoT GEEKS to create user experiences that improve engagement, strengthen trust, and support long-term SEO growth.
The distinction between ‘SEO work’ and ‘UX work’ is dissolving. Teams that still operate them as separate functions are leaving ranking potential on the table. The strategy that wins in 2026 is the one that treats every user interaction as a signal because Google does.
Boost rankings and user engagement with UX-driven SEO strategies from AI-IoT GEEKS
Book a Free Strategy Call at aiiotgeeks.com
Have any questions in mind
Frequently Asked Questions?
Does bounce rate directly affect rankings?
Not in isolation. Google has clarified that a high bounce rate is not always negative a user who gets a quick answer and leaves satisfied is not a bad signal. The harmful variant is pogo-sticking: bouncing back to the SERP and immediately clicking a competitor’s result. That is a direct quality signal that can suppress rankings.
How long until Core Web Vitals improvements affect rankings?
CrUX data is aggregated over a 28-day rolling window, so meaningful data changes take 4–6 weeks to appear. Ranking movement typically follows within another 2–4 weeks, varying by site authority and query competitiveness.
Can good UX compensate for a weak backlink profile?
For long-tail, low-competition queries: often yes. Strong UX signals combined with highly relevant content can rank without significant link equity. For competitive head terms: links remain necessary, but UX can be the differentiator between two pages with comparable authority.
What is the difference between FID and INP?
First Input Delay (FID) only measured the latency of the very first user interaction on a page. Interaction to Next Paint (INP), which replaced FID in March 2024, measures the latency of every interaction throughout the entire session. INP is a significantly more demanding metric and rewards consistently responsive pages rather than pages that only respond quickly to the first tap.
Are Core Web Vitals the same as Page Experience signals?
No. Core Web Vitals (LCP, INP, CLS) are a subset of Google’s broader Page Experience signals, and they are the only ones confirmed as direct ranking factors. Other Page Experience components HTTPS, mobile-friendliness, no intrusive interstitials, safe browsing — contribute to overall quality but Google states they do not independently boost rankings in the way Core Web Vitals scores do.